In July last year I published a chart of P/E ratios by different local exchanges within Japan. What was clear at the time was that smaller exchanges had an anomaly. The post asked “Is there a discount to buying outside Tokyo?”
Today I am revisiting this topic.
Here is a chart of P/E distributions by decile (decile 1 is the most expensive).
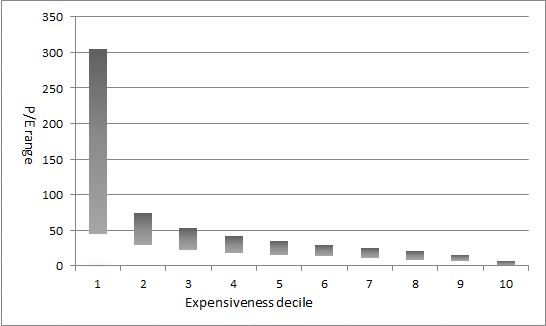 Japan pe ratios by decile
As you can see, the overall market is far from cheap – a lot of rip-off companies, but then a narrow tail of cheap ‘uns.
And here is what you have been waiting for – the updated version of last year’s chart:
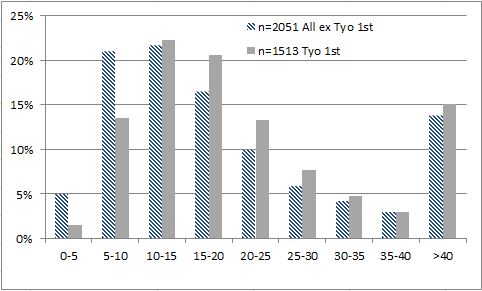 Tokyo vs non-Tokyo pe distribution
As you can see, the significant discrepancy persists in the 0-5 and 5-10 P/E bands.
Now, I have been energetic enough to bring together some statistics (remember I told you I was good at this in school) for regional exchanges:
And this is the same thing for those who cannot read a table of numbers:
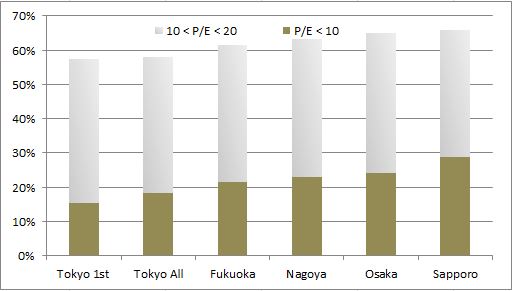 Regional pe frequency chart
Same deal here but for P/BV:
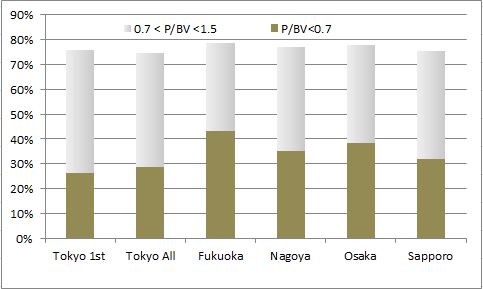 Japan regional stock exchange pbv frequency
And finally, here are some median stats by capitalization band on the Japanese market.
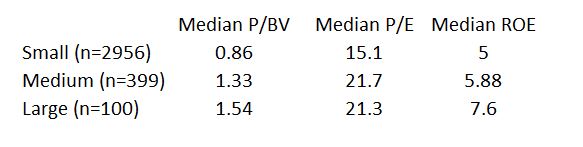 Japan valuation statistics by capitalization band
Perhaps I should point out that the opportunities are still on the small capitalization side of things, but that would be too obvious for my esteemed readers to bear underlining.

{ 0 comments… add one now }